

Stannol – Thermologger 5000
Temperature profile measuring device for reflow, wave and vapour phase soldering systems
Precisely defined temperature profiles are an indispensable prerequisite for perfect soldering results. The adjustment of temperature profiles is becoming increasingly difficult due to reduced process windows. The Stannol Thermologger 5000 offers a cost-effective, yet robust and accurate measuring system that meets the requirements of daily use: With a few simple steps, the measurement setup is prepared and the instrument is ready to measure. The hardware and software are intuitive to use, the user interface is clearly arranged and up-to-date. Even the envelope curve can be drawn manually with a few mouse clicks – simple, fast and accurate.
Product Features
- precise temperature measurement
- dynamic memory management for long measuring times
- with external protective cover for use in reflow and vapour phase soldering systems
- easy-to-use software with important analysis and documentation functions
Application Areas
Temperature profile recording and documentation in soldering processes:
- wave soldering
- reflow soldering
- vapoor phase soldering
- vacuum soldering
Thermologger 5000: Application and Function
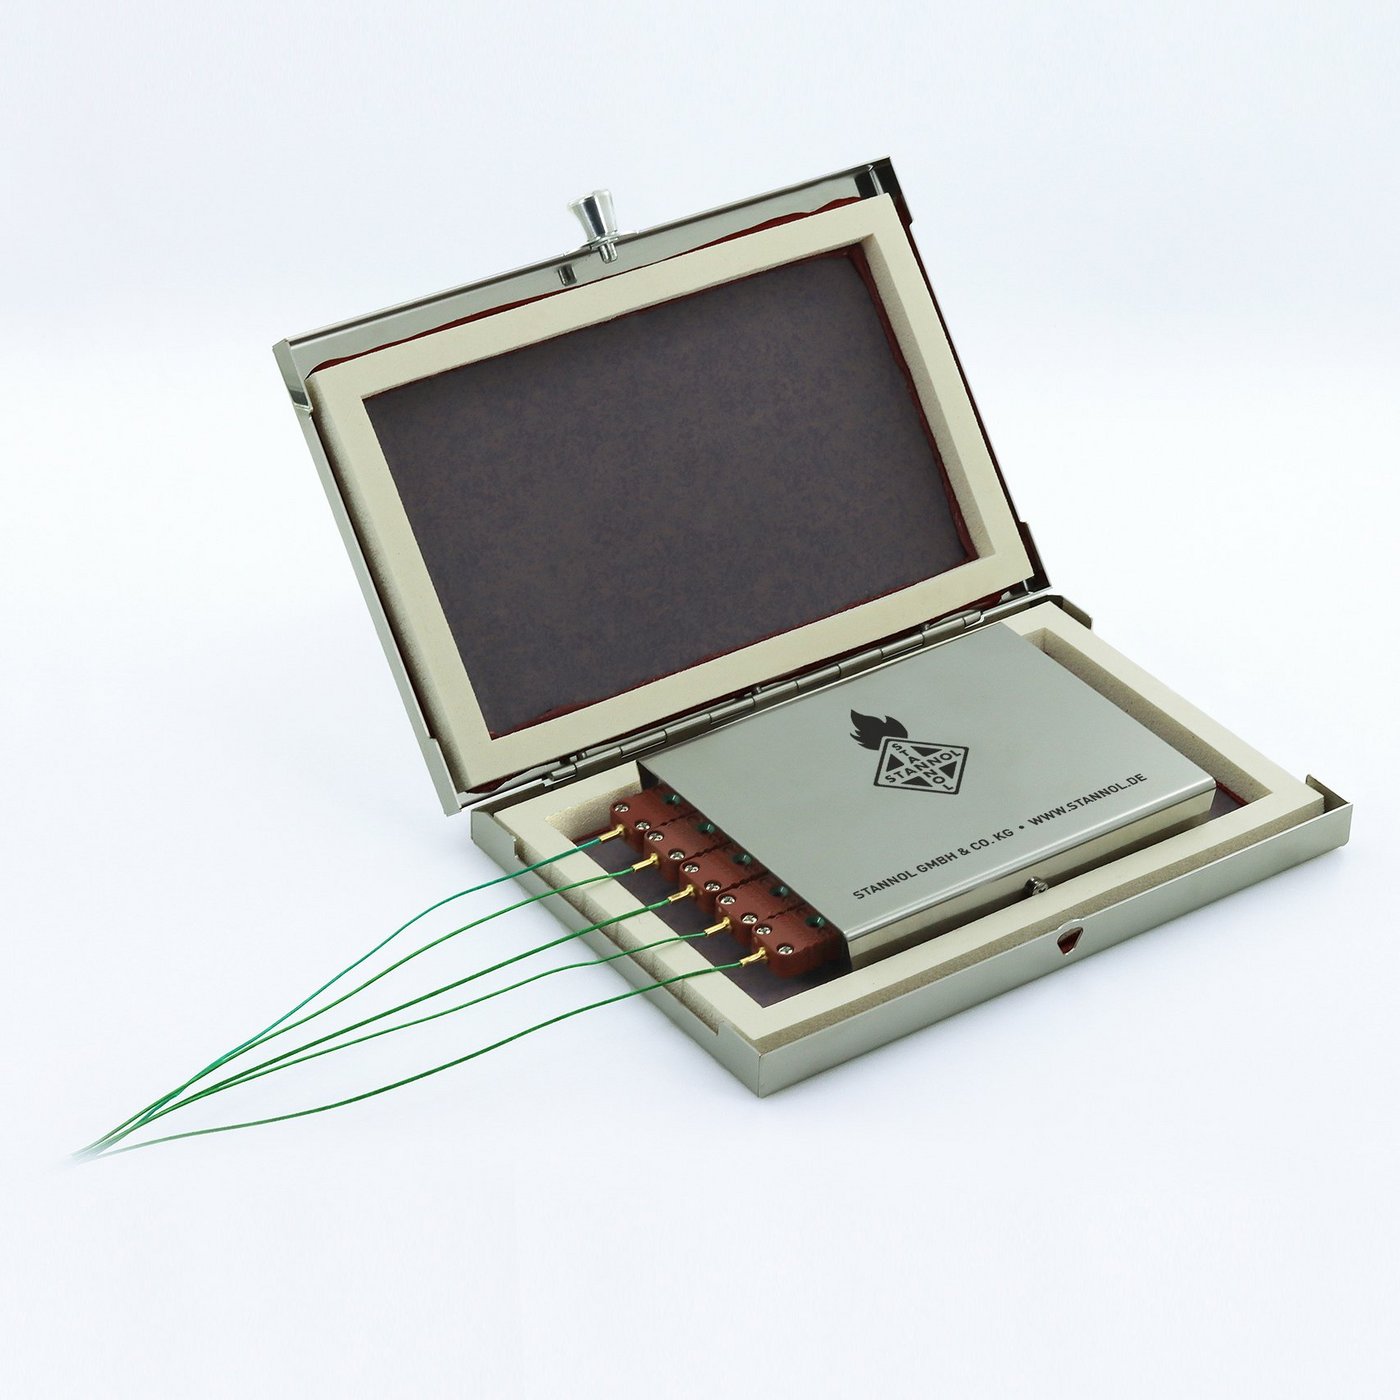
The Stannol Thermologger 5000 offers a cost-effective, yet robust and accurate measurement system that meets the requirements of daily use. Both the hardware and the software are intuitive to use. In just a few steps, the measurement setup is prepared and the device is ready for measurement: To do this, the temperature sensors are simply attached to the PCB to be tested and then connected to the thermologger.
The thermologger is then placed on an empty board and switched on. Now the test PCB can be moved through the soldering system together with the thermologger. Thanks to the separate thermal box, the Thermologger 5000 can also be used in vapour phase soldering systems without any problems. The Stannol Thermologger 5000 has also been designed for use on a solder wave. In wave soldering processes, the temperature changes are sometimes very dynamic. However, due to the high measuring rate, these dynamic processes can also be displayed without any difficulty.
Easy-to-use software
After the actual measurement, the data from the thermologger is transferred to the software via USB connection. After that, the system is ready for further measurements. The software contains a number of functions that facilitate the evaluation of the curve. Nevertheless, the software remains easy to use. In the "Master data" area, information on soldering systems, used solders, envelope curves and the used test PCBs are created. In order to obtain a clear assignment of the measurement results, a picture of the test PCB can also be stored. The position of the individual sensors can be freely defined on this. Names can also be assigned to the individual sensors, which simplifies the assignment of the profiles.
The user can also define a target range by creating an upper and a lower limit profile. If the measured profile leaves the target range, this is indicated to the operator. An evaluation of the profile is therefore possible even without precise process knowledge. By displaying the different zones including the set temperatures of the oven, the machine operator is shown in which zone the corresponding changes have to be made.
All information at a glance
The software interface has been designed in such a way that all important information is available at a glance. For example, the temperature profiles are displayed including the target range. In addition, the user is provided with a tabular overview of the most important parameters. Gradients can also be displayed on the individual curves. Another advantage: Previous measurements can be overlaid so that a direct comparison is possible. Individual curves can also be faded in or out.
Each measurement is assigned the corresponding test conditions, which are stored in the master data.Each measurement is assigned the corresponding test conditions that are stored in the master data. Thus, consistent information does not always have to be re-entered. When printing out, the user receives an overview of test conditions, the temperature profile and the test PCB with the corresponding position of the probes. Both an integrated PDF output and an export of the raw data to an Excel file are available.